


Thanks for reading my bleeding heart the past few issues. A few of you ran away, a few emailed in, it’s a win-win. Leaving is a valid CTA too.
Today we talk about work. The market's been bleeding. Product building and GTM thinking need defibrillation. Retooling process is the way to resurrection! sounds like a delusion but there's truth to it and today I'm joined by Winston Ford, our Senior Product Manager at NewtonX, to chat on how we push strategy out of the box with virtual whiteboards like Figjam, Miro, and Mural.
The tricky part? There's no roadmap for how these tools net you better outcomes. The fun part? There's no roadmap for how these tools net you better outcomes.
Winston's been at ACLU & Planned Parenthood, I've come from the Sweetgreen-meets-Everlane world, somehow our paths converged in B2B data, and I'm glad for it.
Share this with a product or brand leader who might find it valuable. Like or comment on my LinkedIn post; we'd love to hear from you. Thanks :)
Outline:
(00:35) Winston on Figjam for product collab: How do you build something that doesn't exist in the market?
(04:59) Vicky on Figjam for GTM strategy: What happens when you put data on an easel?
(09:24) Winston's final thoughts: Having a shared vision of remote collaboration
(10:29) Vicky's final thoughts: Cultivating creative subcultures in business disciplines
A quick interlude - Who's NewtonX?
To contextualize our chat: At NewtonX, we're the B2B research partner to the stars (like Meta, NYT, MBB). We're the reason they can make high stakes decisions with confidence.
What this looks like: If Figma's looking for competitive intel on other SaaS players, or market data to back thought leadership on the state of design - we find the exact professionals who have those insights, and consult on the process from hypothesis to analysis. (If this sounds like something your company needs, let me know.)
Complementing the services side of the biz - last year we launched our expert intelligence platform, NewtonX Prime. It visualizes data from B2B surveys at scale, to help speed up the timeline from insight to impact.
Transcript
The transcript makes more sense if you watch the video but I know we're all lazies out here so next week I'll post the 1 min snippet to LI. (I recently found out that it's weird to abbreviate LinkedIn to LI in real life but this is the life I live. Mazel tov.)
Vicky: Hi everyone. My name is Vicky. I am our Senior Brand Manager here at NewtonX, and I'm really excited to be here with my colleague Winston, who is our Senior Product Manager. And today we're going to step through ways that we're thinking about using tools in more creative ways to make the work more effective and the outcomes better in the long run. So we're going to dive into tools like Figjam and virtual whiteboards, go through a couple examples, and at the end recap on conceptually how does this materialize in team workflows, and how we approach the work. With that, what I'm going to pass it to Winston.
On Figjam for product collab: How do you build a tool that doesn't exist in the market?
Winston: Awesome. Thanks Vicky. So yeah, I want to talk about NewtonX Prime. It is our new expert intelligence platform that gives our customers their edge on the market. And the way that our customers have been using it is twofold. One, it gives you access to thousands of expert opinions across multiple industries and touch points. And also two, it provides very powerful visualizations that allow you to gain insights and solve, say your hypotheses or whatever you need a lot faster.
So one thing that's really interesting is that this is a very unique product in the market, and we had to go to market as a startup within a startup, which is something that not a lot of startups actually do. So we had to really think about how to work more collaboratively across our teams.
And the other thing is that our teams are remote, so we're spread out all across the country. So generally, a lot of startups start in, say a coffee shop or a garage or some type of conference room, but we actually have to start remotely. So how do we do that?

So the one way that we've really kind of leveraged remote collaboration is with Figjam. Every few weeks we do get together and we actually have physical whiteboards, which is really cool. Obviously a lot of startups do this, but then we leave and we go to our respective homes. So how do we continue to have that energy remotely? We utilize Figjam. You can see this is a customer journey that we've outlined on a whiteboard, but that actually spills over to our Figjams and we're able to really take that energy, that kind spontaneous whiteboard energy into a digital platform.
We use post-it notes. We also bring in rich images, video, anything that we need to help solve problems and going to market. There's a lot of problems that you have to solve quickly and efficiently, and this is our way of doing that. So another thing that's really interesting as well, so we went to market with our beta customers, got a lot of feedback from our customers, and our customers are like, your product is great, but we want to see data over time, and that's really important for us so we can make more informed decisions. Because something that say has a high NPS score last year might have a lower NPS score this year, just because, say there's changes in the market or the product quality has gone down. So we really want to start to capture that. So this is our new time series NPS chart.
This is a chart that does not exist anywhere in the market. So we had to build this from scratch. And we talked to customers, we had a lot of great input and we were able to build this out and convey multiple layers of information here. But the way that we did this, and I'm going to show you how the sauce is made, is we had numerous collaboration touchpoints between design lead and our engineering team, and also with customers to really think through what this experience will look like.

So we kind started with our current NPS experience and then jumping in here, and this is one of the cool things that I like about Figjam is that you can actually kind of jump in. I had an Apple pencil and picked up an iPad, started sketching through things, marking through things, and through that we're able to bring in prototypes and in real time have that collaboration. So it's just one of those things where again, we really want to recreate that in-person experience as much as we can.
On Figjam for GTM strategy: What happens when you put data on an easel?
Vicky: Thanks for sharing, Winston. It's always really cool to see the process behind such a complex product that involves a lot of really deep data visualization for B2B surveys at scale. So with that, I'm going to flip over to the other side. I'm going to share my screen where I'll share my perspective on how we use creative tools like Fig Jam for strategic thinking as well as collaborative on the go-to-market side.
So within marketing campaigns, how do we go to market more effectively? How do we be not only more efficient, but more creative in the output? Because there's such a sheer volume of output that's demanded every day, not just in volume actually, but even customization of content and making sure something is laser sharp. So it resonates really quickly with your target customer who's going to be reading it.
So with that, I'm going to walk through a bit on the editorial process behind one of our campaigns last year that we called The Office: Research Edition, where essentially we respun The Office into an adaptation through the lens of a corporate researcher, so researcher who deals a lot with B2B in an enterprise context. We wanted to honor and celebrate and also commiserate with the realities of their everyday world and also the pain points of the industry and doing B2B research.

So with that, I'm going to jump into our Figjam, which is where it all started. Well, actually where it started was customer interviews, as we are a research company, so staying true to those roots. But I basically had this large glob of a transcript that I pulled out themes, stories, quotes, and terms from what I saw as trends over the course of the customer interviews that I ran. And also pulled out some really interesting earnest deep insights that actually ended up being folded into our personas training for our sales and client facing team. So that was actually also a really cool side effect of this work. It was really helpful to have everything in one place to start to map out the characters in the episode outlines. Mapping out what are the topics, what are the value propositions that we're going to focus on in each episode?
And also who are the researcher archetypes of each character in the office? For example, Dwight might be the intense, really academic quant researcher who's always talking about customer obsession. So it was really fun to imagine this world in the context of a flexible platform. And then that yielded prompts that I fed into ChatGPT to synthesize all of this into screenplays that I then edited and worked with our designer Lori to publish. So yeah, that was an example of how a tool like this really helped content planning and development process.
I'm going to now move to another example that is interesting in that it's a little more exploratory. And this goes back to this is me testing out a hypothesis of - what does it look like to put data on an easel instead of just a spreadsheet?
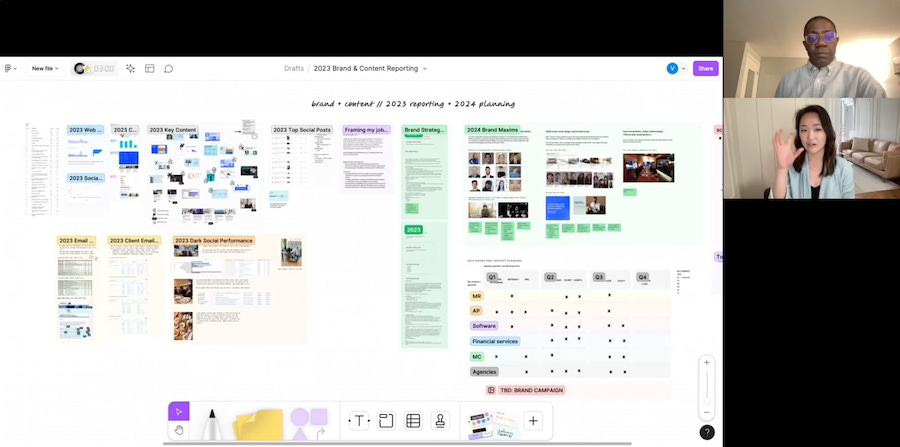
So this is actually me when I was doing some end of year reporting last year and planning for the new year, and I realized I was pulling from so many disparate data sources like Google Analytics or Salesforce, HubSpot, LinkedIn, and I found it really helpful to have the information, the executive summaries of all that dropped in one space so I could start to make connections between those. To find trends in the data and the stories in the data, layered on with anecdotes, with stories of customer successes, especially even layering pictures. You need to remember how you made a customer feel at moments too.
And those are kind of the moments that help you understand, okay, how do we double down on those aspects? And yeah, ultimately use that to start to frame out, okay, what are our brand maxims? What are our pillars for the upcoming year? And this really, it made it a lot quicker to align on priorities and just directionally what we're thinking with our CMO.
So that's kind of all I've got for my end, but ultimately this is really fun, Winston. And I guess as a closing note, would love to hear just conceptually, how are you thinking about using these sorts of tools more effectively to your team? How does it work for your workflows?
Winston's final thoughts: A shared vision of remote collaboration for distributed teams
Winston: I think for us, we kind of went in with a mission or ideal that we want to have collaboration across teams, and it was just very important for us. We're in go to market mode, so we really need to huddle down, but we also were remote, so I think we just aligned a lot quicker on that just because I think we had a shared vision of what we wanted across the team.
And then as we started diving in as a core team, as we started bringing in stakeholders and leaderships, as they kind of saw what we showed, all the whiteboards and all the Figjams, they also were excited and they kind of want to jump in and really help us collaborate. So it was fairly easy for us, but I think it started with that shared vision that we wanted to collaborate and that made things a lot easier for us in terms of how we want to operationalize on it.
Vicky's final thoughts: Cultivating creative subcultures in business disciplines
Vicky: I love that view on collaboration and how creative tools can foster deeper collaboration, quicker alignment, and also just excitement. I think there's a huge part of storytelling to the impact of our work, and it's really cool to see it kind of materialize on your side.
On my side, it's interesting because we're also exploring it from a go-to-market perspective of - how can tools like this, or tools using AI, be a thought partner to strategic work, whether it's independent or collaborative? How does it make us better at go-to market strategy? I think especially on the business side, these disciplines are very strong in operational thinking, very strong in the language and the formats of spreadsheets and data.
And I will say this again, my hypothesis I'm trying to push forward is - what happens when we put data on easel instead of just a spreadsheet? Or how do they complement each other, right? Because the reality is strategic thinking is non-linear. It pulls from multiple inputs that are both qualitative and quantitative, and what does it mean when we are able to marry that sort of the messy thinking with the hard data, and have it all in one place?
And I think in the process, the underlying note is also like, oh, is this culture change too? Or is this not necessarily change, but does this help cultivate more interesting, more creative subcultures even within a business discipline? Or how does it make us just more diverse and rich in how we think and work and operate with each other?
I think with that, that's all we have for y'all for now. We would love for this to be a dialogue, so feel free to reach out, drop something in the comments. We'd love to chat more.

Share this post